Contents
Today's manufacturing plants, powered by digital transformation, operate like living digital systems that generate data around the clock. As data volumes grow, sensor readings, electrical signals from PLCs and the constant stream of data packets sent by IoT devices form an invisible data ecosystem across the factory floor. Data has become so important that processing it is now the heart of modern manufacturing. Yet when it comes to how much of this data is actually put to use and how much sits idle, reports show that despite advances in digital transformation and data mining, a large share still flows into storage in raw form and is never processed. According to Forrester, between 60% and 73% of data within an enterprise is never used for analytics. The real value, however, lies in refining this raw material and turning it into operational results. Data is only as valuable as the action we can take on it.
The Data Value Chain: How the Right Data Is Transformed
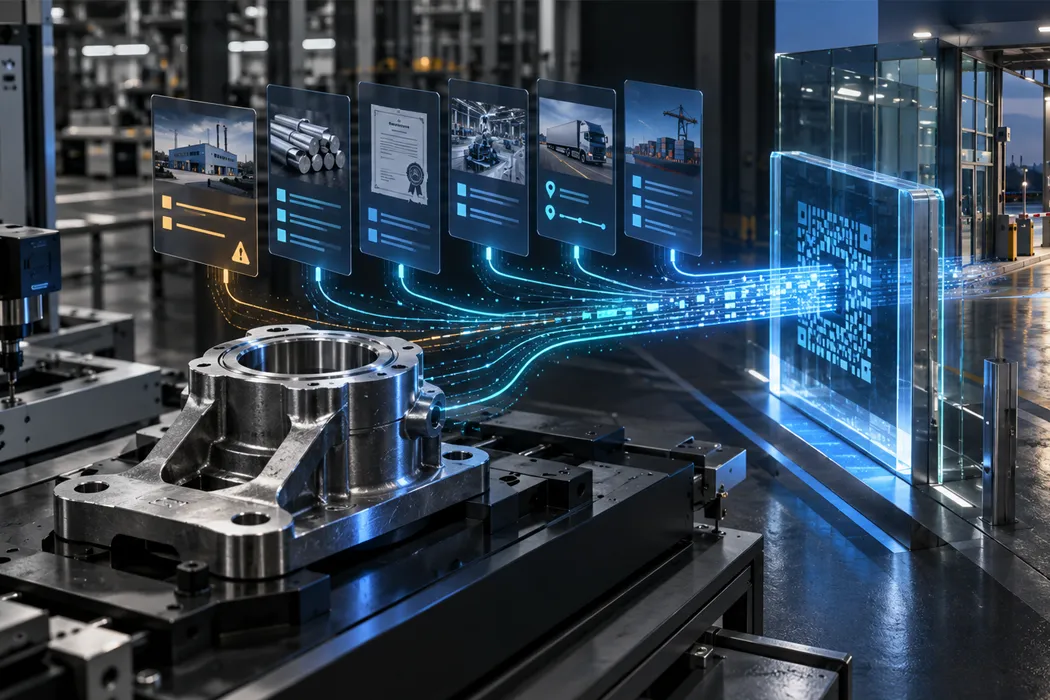
Like veins of gold deep underground waiting to be mined, piles of idle data hold enormous potential for operational value. The journey of data into "invisible gold" can be summarized in three core stages: data collection, data analysis, and turning analytical insights into decisions. You can think of these as the beginning, middle and end of the story.
In the first stage, data collection, the raw signals from sensors that monitor machines continuously are filtered and cleaned by edge computing devices. The raw data streams generated by sensors, PLCs and industrial IoT devices are captured and pre-processed in real time on edge devices. Algorithmic detection of anomalies in vibration or temperature data is a typical example of this stage. Industrial protocols such as OPC UA and MQTT are used to transmit the data securely and in a standardized way, so that raw data from the shop floor is cleared of noise and ready for analysis. This highly technical stage is the preparation phase. At an automotive supplier in Germany, for example, vibration data from CNC machines is processed instantly at this stage; algorithms that know the machines' normal patterns inside out recognize abnormal frequencies and separate clean data from misleading noise.
The second stage, data analysis, is the middle of the story: this is where raw data is refined by machine learning. Analytics in this phase usually runs on cloud-based platforms (Azure IoT, AWS IoT Analytics), which provide flexible computing capacity and scalability. In other words, the filtered data is processed with machine learning models. In the process, complex patterns such as failure signatures, quality deviations or energy consumption trends are identified. At a home appliance manufacturer, for example, energy consumption data from industrial ovens is combined with thermodynamic simulations; by tracking how heat is distributed, engineers discover optimization formulas that deliver 18% energy savings.
In the final stage, these analytical insights turn into operational decisions, in other words, into action. This is the phase in which the insights gained are translated into concrete operational decisions. Automated decision support systems come into play here: for example, equipment shuts down automatically when an anomaly is detected in pressure sensor data. Integrated with ERP and MES systems, these mechanisms adjust production plans dynamically and in real time. A pharmaceutical manufacturer, for instance, works with humidity and temperature data from its sterilization rooms; process times are optimized with mathematical models, and in this way production line efficiency can be increased by 15%. This closed-loop process shows the data chain being completed with operational value. Data has been refined like gold and turned into value for a manufacturing operation.
The Benefits of Seamless, Integrated Data Management
Traditional manufacturing environments often face one fundamental problem that is also the biggest obstacle to this transformation: the gap between operational technology (OT) and information technology (IT). It is a very technical problem, namely the data disconnect between IT and OT. Traditional data management keeps these two worlds apart, and data from the shop floor never reaches the engineers' labs. The DataOps model is the bridge that closes this gap.
Machine data from the shop floor often fails to reach analytics systems in the office, or arrives in formats that cannot be used. The DataOps approach acts as a bridge that integrates these two worlds. Horizontal integration brings data from different machines together on a single platform, while vertical integration passes this data on to enterprise systems such as ERP. In other words, it creates a layer between systems that removes the disconnect. Put simply, it is a system that keeps data processing running continuously through automation, so that data flows without human intervention. Data quality management is added on top, a method for detecting faulty sensor readings in real time. Data engineers and production technicians work in the same team, aligning technical analysis with operational needs. This integrated approach keeps data flowing and turns it into tangible efficiency gains. Equipment failures can be predicted in advance through data analysis. Overall Equipment Effectiveness (OEE) rises by at least 15%: machines run longer within their planned operating time and quality rates improve. Maintenance costs can fall by 30-40%. In short, DataOps can be described as a bridge designed to ensure that data flows without interruption from the shop floor to management dashboards and is turned into meaningful action. It brings data collection, processing and application together under a single discipline; without it, data stays fragmented and the efficiency gains and other benefits never materialize. The tangible improvements in operational efficiency prove the economic case for this transformation. In other words, with DataOps and intelligent data chains, this "invisible gold" can be turned into operational excellence. Once the data value chain is in place, the next critical step is turning these insights into action.
Turning Decisions into Action and Integrating Them into Production
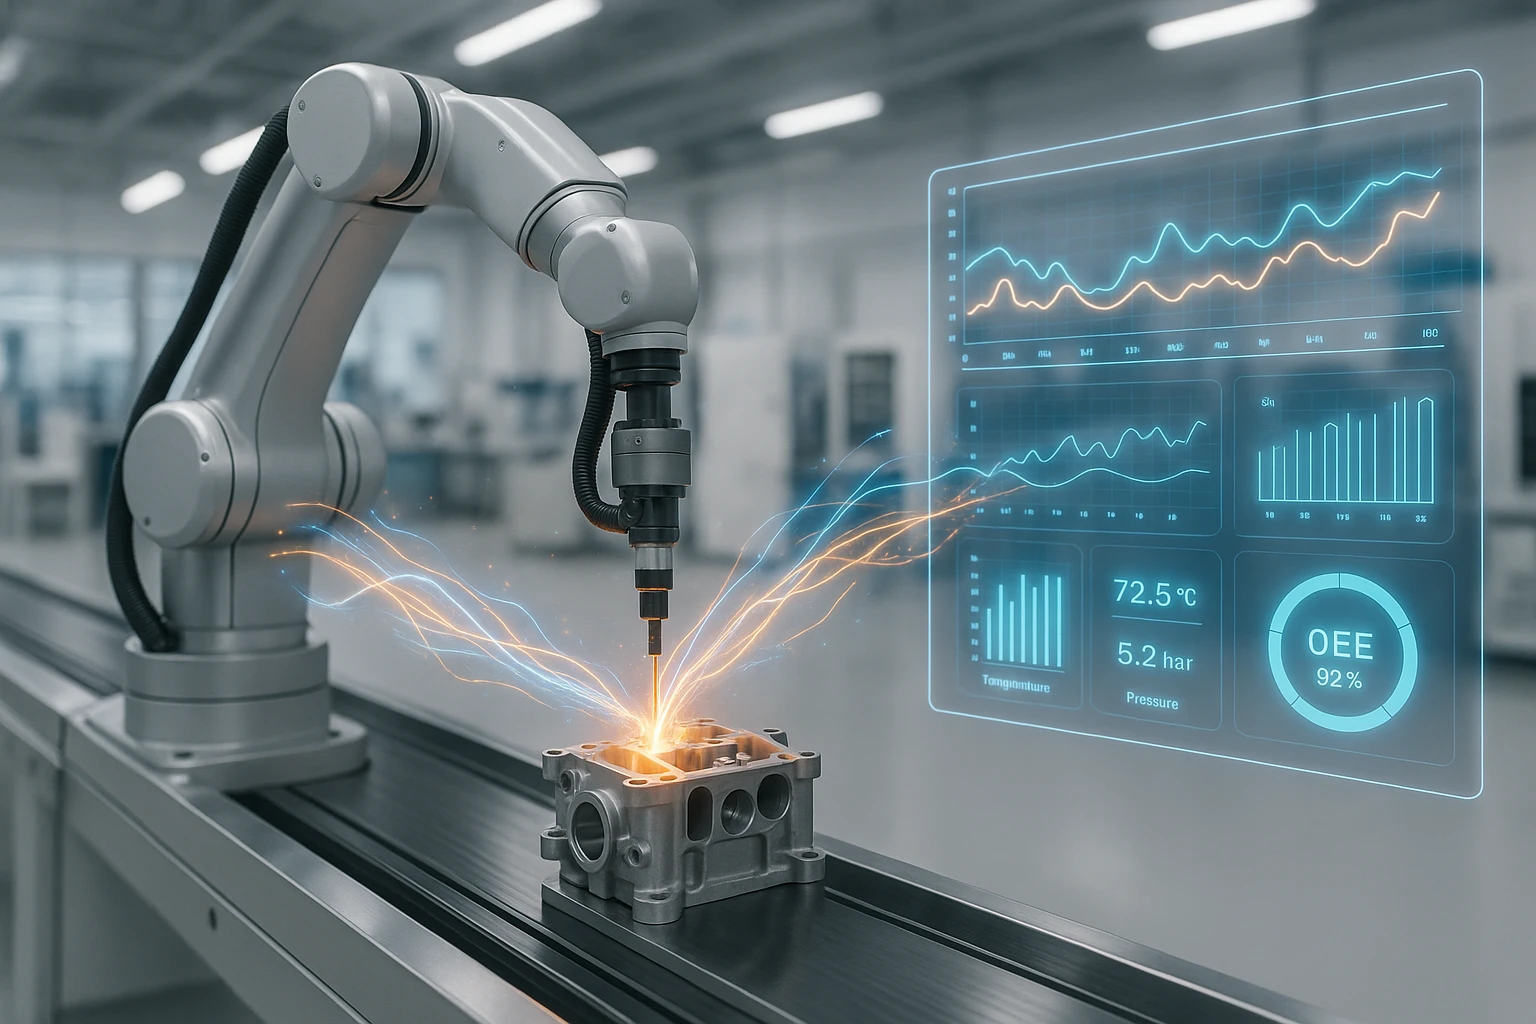
Insights from data analytics only create real value when they are applied to operations immediately. Integrated systems turn data from a raw pile into a usable asset that becomes the basis for optimizing operations. The most important part of this integration is the dynamic optimization of machine settings. For example, an automotive supplier's welding robots can process real-time temperature and pressure data from sensors and adjust their parameters within milliseconds. The system automatically compensates for variations in material thickness and reduces the number of out-of-spec welds by 37%. Similarly, on a printed circuit board, conductor track data from an optical measurement system can be transmitted instantly so that deviations are corrected with micron-level precision. This makes efficient manufacturing possible at a speed and precision that people would struggle to achieve.
Beyond production itself, data also enables precise planning in the run-up to manufacturing. Japanese automotive companies that follow the Just in Time approach, for example, benefit greatly from this. Adjusting production plans to demand is the strategic side of data transformation. For any manufacturer, demand forecasting is critical. Demand forecasting algorithms integrated with ERP systems analyze market trends, inventory levels and supply chain risks at the same time. A home appliance manufacturer, for example, can anticipate 40% swings in seasonal demand an average of 3 weeks in advance and update its production schedule automatically. This significantly reduces overtime costs and lowers inventory carrying costs. In supply chain crises in particular, the system makes it possible to reconfigure production recipes so that alternative raw material sources can be brought in within 48 hours. This kind of agility is essential in today's supply chains.
Data also plays an important role in quality. Data-driven root cause analysis is used to resolve quality problems. Unlike traditional trial-and-error methods, AI-powered systems correlate failure signals with production parameters and isolate the source of a problem within seconds. This makes resolving quality issues faster and more agile, and raises productivity. In quality management, data is not just a metric; it also plays a critical role in uncovering the underlying causes of problems. Data-driven Root Cause Analysis (RCA) goes beyond traditional trial and error and offers a systematic approach to solving quality problems. AI-powered systems correlate failure signals with production parameters (temperature, pressure, vibration, energy consumption, etc.) in real time and isolate the root cause within seconds. In other words, data-driven RCA is not just a firefighting tool but a lever for continuously building quality excellence. Continuity is critical here. Production lines become more efficient while the "continuous improvement" requirement of quality standards such as ISO 9001 is also met.
Integrating data-driven decisions into manufacturing is not only a technical transformation; it also requires a change in organizational mindset. From optimizing machine settings in milliseconds to demand-driven production planning and fundamentally improved quality processes, data has become manufacturing's new reflex. This transformation is the foundation not only of competitive advantage but also of sustainable production. Data is no longer a by-product flowing along the production line; it is consolidating its role as an invisible but powerful partner that drives decisions, speed and quality.